
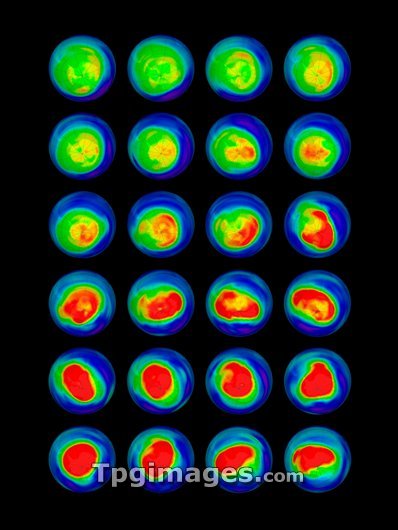
Water vapour maps of Antarctica. Satellite images of the increase in water vapour over Antarctica from 13 August to 14 October 2004 (the austral spring). The sequence starts at upper left, and runs from right-to-left and top-to-bottom, ending at lower right. The relative amount of water vapour varies from low (green) through yellow to high (red). This increase in water vapour accompanies the formation of the ozone hole. The data was obtained by the Microwave Limb Sounder (MLS) instrument on NASA's AURA satellite.
| px | px | dpi | = | cm | x | cm | = | MB |
Details
Creative#:
TOP03206586
Source:
達志影像
Authorization Type:
RM
Release Information:
須由TPG 完整授權
Model Release:
N/A
Property Release:
N/A
Right to Privacy:
No
Same folder images:
OZONEHOLEEARTHWATERVAPOURREGIONPLANETANTARCTICAEARTHOBSERVATIONEARTHSCIENCEATMOSPHERICSCIENCECLIMATOLOGYMONTAGESATELLITEIMAGEAURAMICROWAVELIMBSOUNDERSATELLITE21STCENTURY2004SPRINGSCIENCESATMOSPHEREEARTH'SCLIMATOLOGICALFROMSPACEANTARCTICCLIMATECHANGEMLSCFCCFCSSEASONALMAPMAPIMAGESSEQUENCECHANGEINCREASEINCREASINGGREENHOUSEGASGASESOZONELAYEROZONEDEPLETION
200421STANTARCTICANTARCTICAATMOSPHEREATMOSPHERICAURACENTURYCFCCFCSCHANGECHANGECLIMATECLIMATOLOGICALCLIMATOLOGYDEPLETIONEARTHEARTHEARTHEARTH'SFROMGASGASESGREENHOUSEHOLEIMAGEIMAGESINCREASEINCREASINGLAYERLIMBMAPMAPMICROWAVEMLSMONTAGEOBSERVATIONOZONEOZONEOZONEPLANETREGIONSATELLITESATELLITESCIENCESCIENCESCIENCESSEASONALSEQUENCESOUNDERSPACESPRINGVAPOURWATER
 Loading