
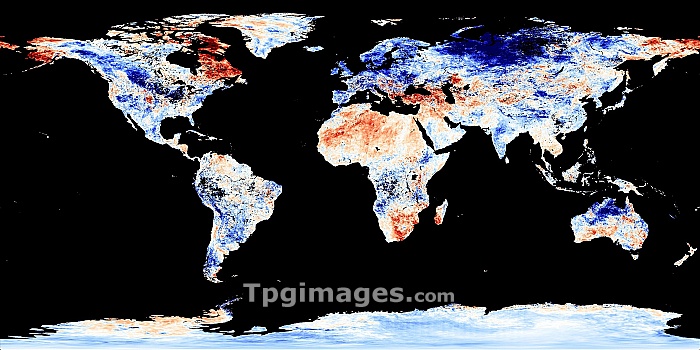
Global temperature anomalies. World satellite map of global land surface temperature anomalies in the period from 19-26 December 2009. Red indicates hotter temperatures and blue indicates cooler temperatures. The extremes (dark blue and dark red) were twelve degrees Celsius cooler and hotter. Areas with warmer seasons include the Labrador region of Canada, Alaska, the Sahara, and southern Africa. Areas cooler than normal include Europe and northern Russia. Data obtained by the MODIS sensor on NASA's Terra satellite.
| px | px | dpi | = | cm | x | cm | = | MB |
Details
Creative#:
TOP06659795
Source:
達志影像
Authorization Type:
RM
Release Information:
須由TPG 完整授權
Model Release:
NO
Property Release:
NO
Right to Privacy:
No
Same folder images:
earthplanetmapearthgeographymeteorologyclimatologyphysicalgeographysatelliteimagemodelsatelliteterramodis21stcentury2009decemberclimatechangeclimatologicalcoldfromspacefrozengeographicalglobalwarminghotlandsurfacetemperatureanomalymeteorologicalnasanorthernhemisphereplanetarysouthernhemispheresummerwarmweatherwinterworldwideanomaliesextremeextremesanomalytemperatureshottercooler"
"200921stanomaliesanomalyanomalycenturychangeclimateclimatologicalclimatologycoldcoolerdecemberearthearthextremeextremesfromfrozengeographicalgeographygeographyglobalhemispherehemispherehothotterimagelandmapmeteorologicalmeteorologymodelmodisnasanorthernphysicalplanetplanetarysatellitesatellitesouthernspacesummersurfacetemperaturetemperaturesterrawarmwarmingweatherwinterworldwide
 Loading