
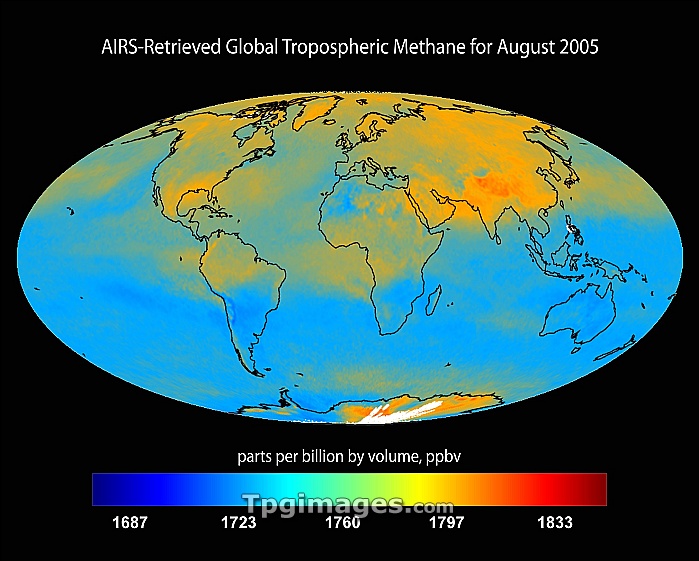
Global tropospheric methane, 2005. Map showing the global variation of the greenhouse gas methane in the troposphere in August 2005. A scale is at bottom in parts per billion by volume (ppbv), ranging from low (blue) to high (orange and red). This and similar maps are used to study the natural and human sources of methane, and its global and seasonal variations. This global data was obtained by the AIRS (Atmospheric Infrared Sounder) instrument on NASA's Aqua satellite.
| px | px | dpi | = | cm | x | cm | = | MB |
Details
Creative#:
TOP06661167
Source:
達志影像
Authorization Type:
RM
Release Information:
須由TPG 完整授權
Model Release:
NO
Property Release:
NO
Right to Privacy:
No
Same folder images:
earthplanetmapearthatmosphereclimatologyearthscienceenvironmentalscienceatmosphericchemistrysatelliteimagemodelairsinfraredaqua21stcentury2005augustannualatmosphericatmosphericinfraredsoundermethanech4climatechangeclimatologicalearthsciencesexperimentfromspaceglobalglobalwarminggreenhousegaskeyresearchscalevariationvariations"
"200521stairsannualaquaatmosphereatmosphericatmosphericatmosphericaugustcenturych4changechemistryclimateclimatologicalclimatologyearthearthearthearthenvironmentalexperimentfromgasglobalglobalgreenhouseimageinfraredinfraredkeymapmethanemodelplanetresearchsatellitescalesciencesciencesciencessounderspacevariationvariationswarming
 Loading