
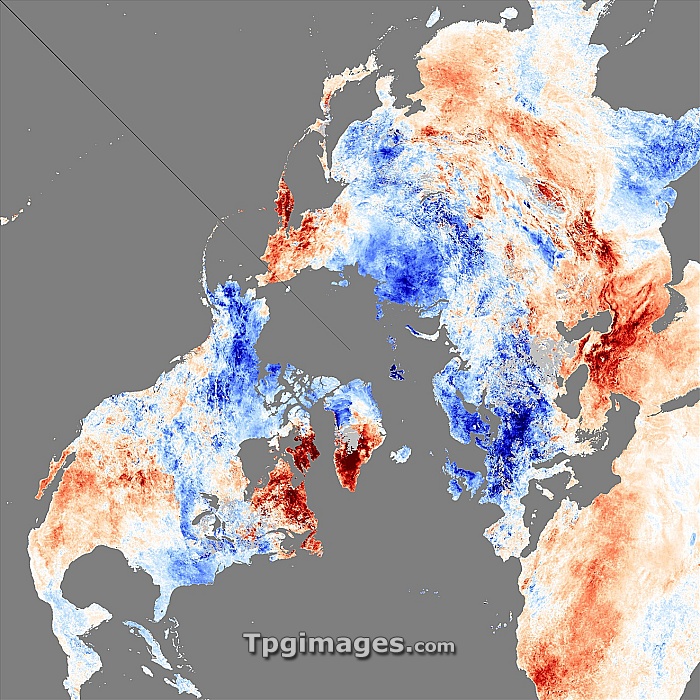
Land temperatures. Map showing northern hemisphere land surface temperatures in December 2010 compared to the average temperature for the same period between 2002 and 2009. Blue areas are cooler than average and red areas are warmer than average. While north Europe and most of eastern North America were colder than average, Greenland and parts of Canada were exceptionally warm. This was caused by a negative Arctic Oscillation, which arises when the two opposing pressure systems over the Arctic (low pressure) and mid-latitudes (high pressure) are weak. Cold air from the Arctic moved south causing heavy snow fall, while some warm air seeped north. Image obtained by the Moderate Resolution Imaging Spectrometer (MODIS) on NASA's Aqua satellite.
| px | px | dpi | = | cm | x | cm | = | MB |
Details
Creative#:
TOP07423496
Source:
達志影像
Authorization Type:
RM
Release Information:
須由TPG 完整授權
Model Release:
NO
Property Release:
NO
Right to Privacy:
No
Same folder images:
 Loading