
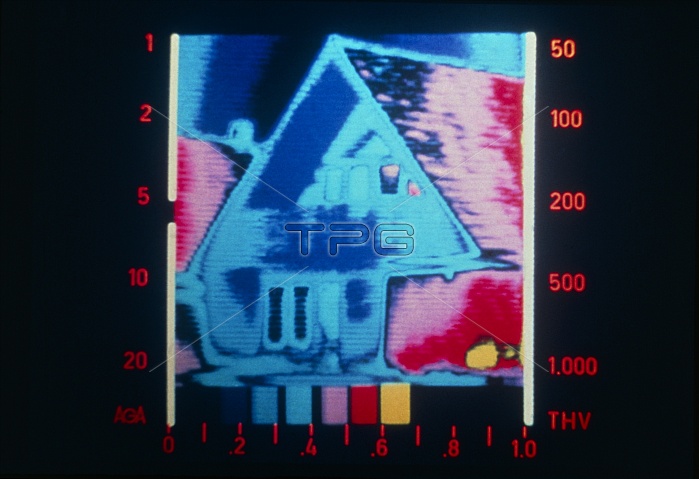
Thermograph showing the distribution of heat on the external surface of a domestic house. Area of greatest heat loss corresponds to the yellow, red & pink coding (see bar chart at bottom of transparency).
| px | px | dpi | = | cm | x | cm | = | MB |
Details
Creative#:
TOP10193953
Source:
達志影像
Authorization Type:
RM
Release Information:
須由TPG 完整授權
Model Release:
N/A
Property Release:
N/A
Right to Privacy:
No
Same folder images:
 Loading