
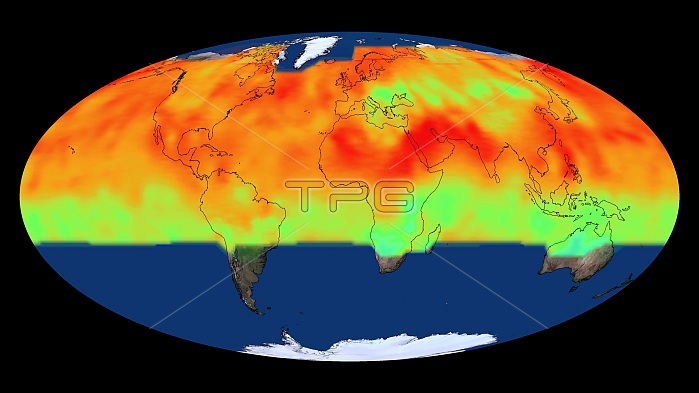
Global CO2 concentrations. Mollweide projected map of global carbon dioxide (CO2) data from 31 May 2015. The concentrations of CO2 are colour-coded from low (blue) through moderate (green) to higher (yellow) and high (red). The CO2 concentration is in parts per million (ppm), from 390 (dark blue) to 405 (dark red) ppm. CO2 concentrations increase across the northern hemisphere from winter to spring. This data was obtained by the Orbiting Carbon Observatory-2 (OCO-2) mission, a satellite operated by NASA. This satellite tracks changes in CO2, a greenhouse gas that is one of the causes of climate change and global warming.
| px | px | dpi | = | cm | x | cm | = | MB |
Details
Creative#:
TOP16085304
Source:
達志影像
Authorization Type:
RM
Release Information:
須由TPG 完整授權
Model Release:
N/A
Property Release:
N/A
Right to Privacy:
No
Same folder images:
 Loading