
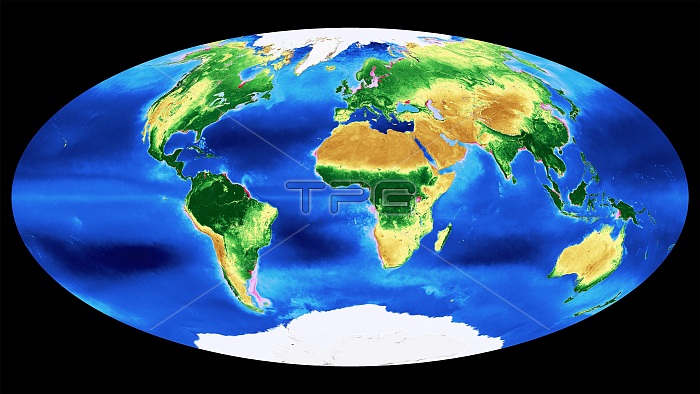
Global biosphere, annual cycle. Global map based on satellite data showing the yearly cycle of plant life on the land and in the water. On land, the images represent the density of plant growth, while in the oceans they show the chlorophyll concentration from tiny, plant-like organisms called phytoplankton. High plant growth on land is shown in dark green (as in the tropics). High plant growth in the oceans is shown in pink (example is the area off south-eastern South America). This image (October) was generated by combining data from many satellite instruments and averaging them over a period of nearly 10 years. The results were published in 2015.
| px | px | dpi | = | cm | x | cm | = | MB |
Details
Creative#:
TOP16085310
Source:
達志影像
Authorization Type:
RM
Release Information:
須由TPG 完整授權
Model Release:
N/A
Property Release:
N/A
Right to Privacy:
No
Same folder images:
 Loading