
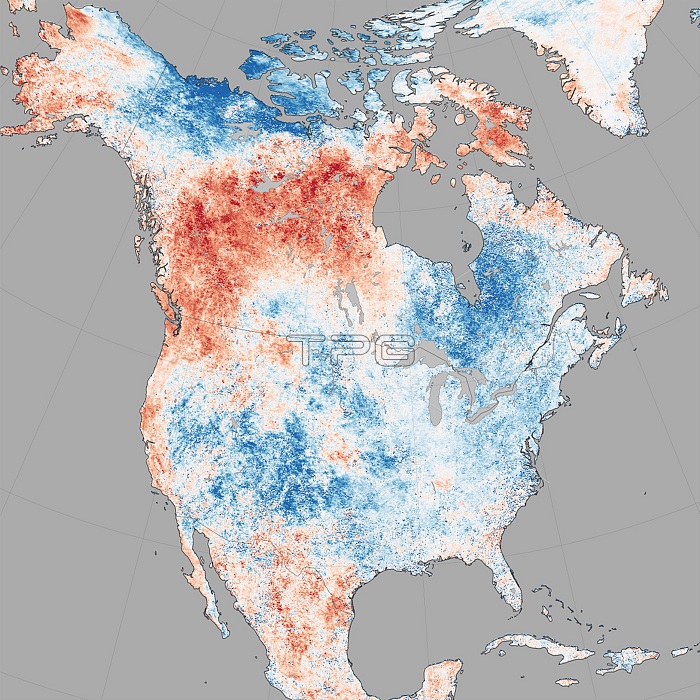
In the summer of 2014, cool air moved from high northern latitudes into much of the US, setting record-low daytime and nighttime temperatures as far south as Florida and Georgia. This map shows land surface temperature (LST) anomalies for July 27-August 3, 2014. They were built from data collected by MODIS on NASA's Aqua satellite, and the 2014 data is compared to the average for the same week as observed from 2005-2013. Observed by satellites uniformly across the entire globe, land surface temperatures are a measure of the amount of infrared energy emitted by Earth's surface as it is heated by daylight and cooled in the dark of night. LST anomalies are not absolute temperatures; instead, they show how much temperatures were above or below the average. The darkest reds show areas that were as much as 20簞F above the norm; blues show areas that were below normal; light gray depicts areas with incomplete data (often due to cloud cover, such as in the area of the Indian monsoon); dark gray is ocean.
| px | px | dpi | = | cm | x | cm | = | MB |
Details
Creative#:
TOP22092762
Source:
達志影像
Authorization Type:
RM
Release Information:
須由TPG 完整授權
Model Release:
N/A
Property Release:
No
Right to Privacy:
No
Same folder images:
 Loading