
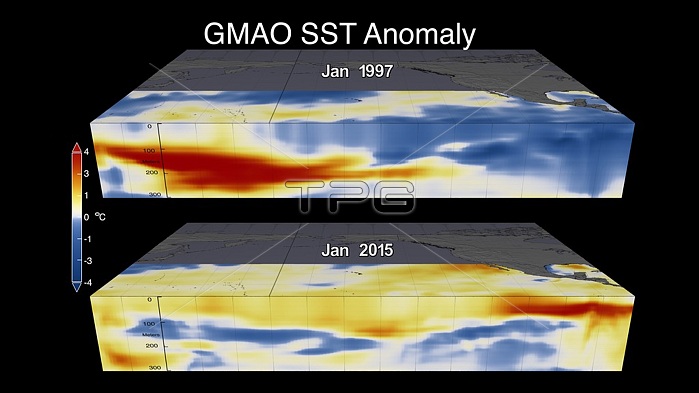
Visualization shows how the Sea Surface Temperature Anomaly (SSTA) data and subsurface Temperature Anomaly from the 1997 El Nino year compares to the 2015 El Nino year. The visualization shows how the 1997 event started from colder-than-average sea surface temperatures, but the 2015 event started with warmer-than-average temperatures not only in the Pacific but also in in the Atlantic and Indian Oceans.
| px | px | dpi | = | cm | x | cm | = | MB |
Details
Creative#:
TOP22094039
Source:
達志影像
Authorization Type:
RM
Release Information:
須由TPG 完整授權
Model Release:
N/A
Property Release:
No
Right to Privacy:
No
Same folder images:
21stcentury20thcentury20151997visualizationmapdiagramcomparisoncomparingcompareseasurfacetemperaturesstadatasstaseasurfacetemperatureanomalyensoelninosouthernoscillationelni簽osouthernoscillationatmosphericphenomenaatmosphericphenomenoncyclicalweatherpatternglobalweatherpatternpacificoceanoceanographicaloceanographicoceanographymeteorologicalmeteorologyeventelninoelni簽oclimateclimatologyresearchscience
1997201520th21stanomalyatmosphericatmosphericcenturycenturyclimateclimatologycomparecomparingcomparisoncyclicaldatadiagramelelelelensoeventglobalmapmeteorologicalmeteorologyninoninoni簽oni簽ooceanoceanographicoceanographicaloceanographyoscillationoscillationpacificpatternpatternphenomenaphenomenonresearchscienceseaseasouthernsouthernsstasstasurfacesurfacetemperaturetemperaturevisualizationweatherweather
 Loading