
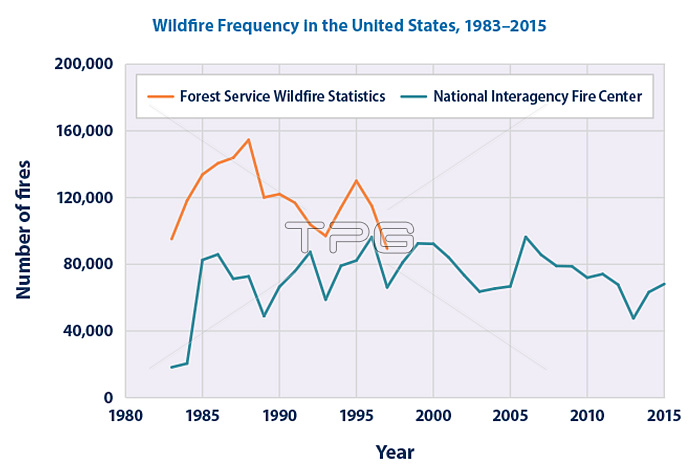
This EPA graph shows the total number of wildfires per year from 1983 to 2015. These totals include all reported wildfires, which can be as small as just a few acres. The two lines represent two different reporting systems; though the Forest Service stopped collecting statistics (orange line) in 1997 and will not update them, those statistics are shown here for comparison.
| px | px | dpi | = | cm | x | cm | = | MB |
Details
Creative#:
TOP22095988
Source:
達志影像
Authorization Type:
RM
Release Information:
須由TPG 完整授權
Model Release:
N/A
Property Release:
No
Right to Privacy:
No
Same folder images:
 Loading