
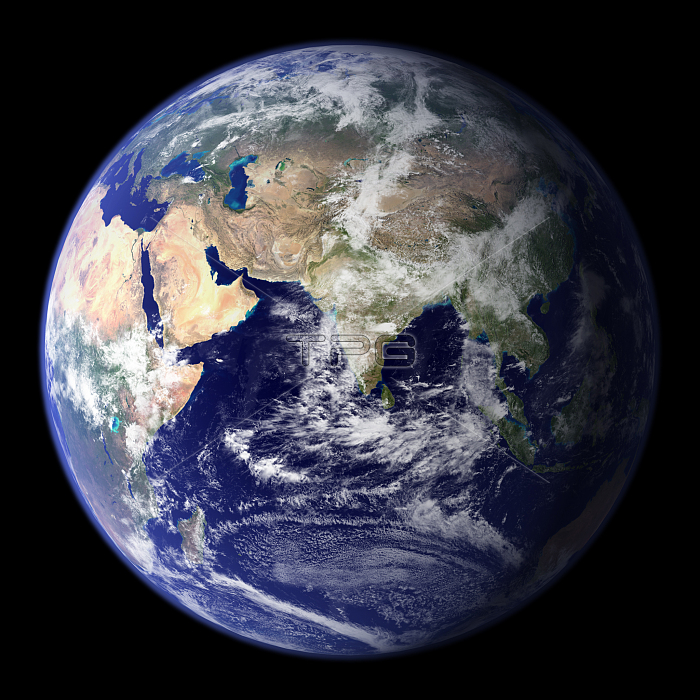
Using a collection of satellite-based observations, scientists and visualizers stitched together months of observations of the land surface, oceans, sea ice, and clouds into a seamless, true-color mosaic of every .386 square mile of our planet. Much of the information contained in this image came from NASA's MODIS. The land and coastal ocean portions are based on surface observations collected from June- September 2001 and combined, or composited, every eight days to compensate for clouds that might block the sensors view of the surface on any single day. Two different types of ocean data were used in these images: shallow water true color data, and global ocean color data. Topographic shading is based on the GTOPO 30 elevation data set compiled by the USGS's EROS Data Center. MODIS observations of polar sea ice were combined with observations of Antarctica made by the NOAA's AVHRR sensor. The cloud image is a composite of two days of imagery collected in visible light wavelengths and a third day of thermal infra-red imagery over the poles. Global city lights, derived from 9 months of observations from the Defense Meteorological Satellite Program, are superimposed on a darkened land surface map.
| px | px | dpi | = | cm | x | cm | = | MB |
Details
Creative#:
TOP22289880
Source:
達志影像
Authorization Type:
RM
Release Information:
須由TPG 完整授權
Model Release:
N/A
Property Release:
No
Right to Privacy:
No
Same folder images:
 Loading