
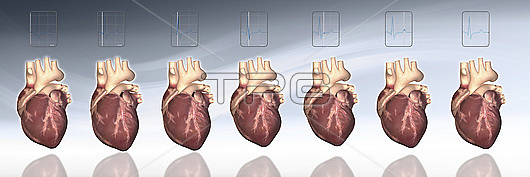
Illustration of seven hearts states of action. Each heart is accompanied by the corresponding electrocardiogram (ECG) diagram showing the heart's electric activity. The first two diagrams from left show the activation of the atria, or the P-wave, stage. The next four diagrams represent the activation of the ventricles, or the QRS-complex. The last one diagram shows the recovery wave, or T-wave, when the ventricles relax.
| px | px | dpi | = | cm | x | cm | = | MB |
Details
Creative#:
TOP27778975
Source:
達志影像
Authorization Type:
RM
Release Information:
須由TPG 完整授權
Model Release:
N/A
Property Release:
N/A
Right to Privacy:
No
Same folder images:
cgidigitallygeneratedartworkillustration3dgreybackgroundbeatingheartheartbeatheartrhythmheartcyclerhythmheartfrequencypulseaortapericardiumrightatriumleftatriumrightventricleleftventriclepulmonaryarterypumpingbloodbloodcirculationsystolediastoleecgcontractionrelaxationelectrocardiogramcardiologyheartcurvesP-waveQRS-waveQRS-complexT-waveno-onenobody
3dP-waveQRS-complexQRS-waveT-waveaortaarteryartworkatriumatriumbackgroundbeatingbloodbloodcardiologycgicirculationcontractioncurvescyclediastoledigitallyecgelectrocardiogramfrequencygeneratedgreyheartheartheartheartheartheartbeatillustrationleftleftno-onenobodypericardiumpulmonarypulsepumpingrelaxationrhythmrhythmrightrightsystoleventricleventricle
 Loading