
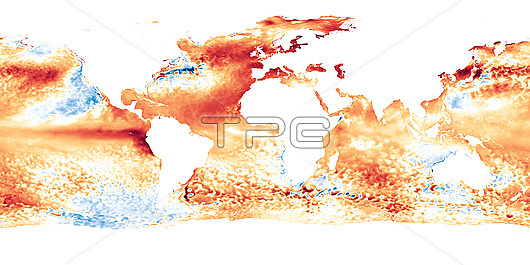
Map displaying the global sea surface temperatures in April 2023. The colours on the map indicate how much the monthly sea surface temperature differs from the long-term average (1985-1993). The red areas indicate warmer-than-average temperatures, while the blue areas indicate cooler-than-average temperatures. The darker the colour, the more significant the difference from the long-term average. White and very light areas indicate near-average temperatures. An above-average sea surface temperature in the central and eastern Pacific is one of the indicators of El Nino conditions, which is the warm phase of a major climate pattern called the El Nino Southern Oscillation (ENSO). Though every ENSO cycle is different, El Nino tends to increase global temperatures an average of 0.2 degrees. However, this cycle is occurring in the context of an already very warm global ocean and scientists do not yet know how this will affect El Nino's atmospheric conditions. Data obtained from the NOAA Coral Reef Watch.
| px | px | dpi | = | cm | x | cm | = | MB |
Details
Creative#:
TOP29330249
Source:
達志影像
Authorization Type:
RM
Release Information:
須由TPG 完整授權
Model Release:
N/A
Property Release:
N/A
Right to Privacy:
No
Same folder images:
 Loading