
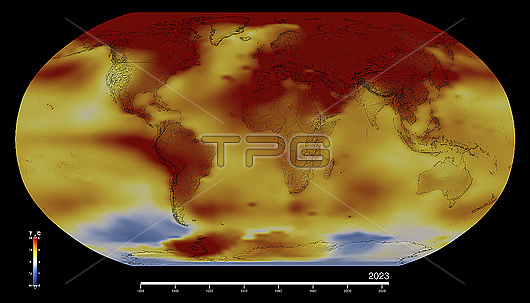
Map displaying average land and sea surface temperatures in 2023, compared to the average temperatures from 1951 to 1980. Areas that are hotter than this baseline are red, those that are cooler are blue, with darker shades representing a greater divergence. The colour scale ranges 2 degrees Celsius above and below average. Earths average surface temperature in 2023 was the hottest since modern record-keeping began in 1880, around 1.1 degrees Celsius above the baseline. Each month from June to December 2023 set a new respective record for highest average temperature, with July being the hottest month on record. This continues a long-term warming trend that has seen the past nine years being the warmest of the past 140 years. Scientists attribute this warming to increased carbon dioxide and other greenhouse gases in the atmosphere due to human activity. Data obtained with with Goddard Institute for Space Studies (GISS) Surface Temperature Analysis (GISTEMP).
| px | px | dpi | = | cm | x | cm | = | MB |
Details
Creative#:
TOP29679002
Source:
達志影像
Authorization Type:
RM
Release Information:
須由TPG 完整授權
Model Release:
N/A
Property Release:
N/A
Right to Privacy:
No
Same folder images:
 Loading