
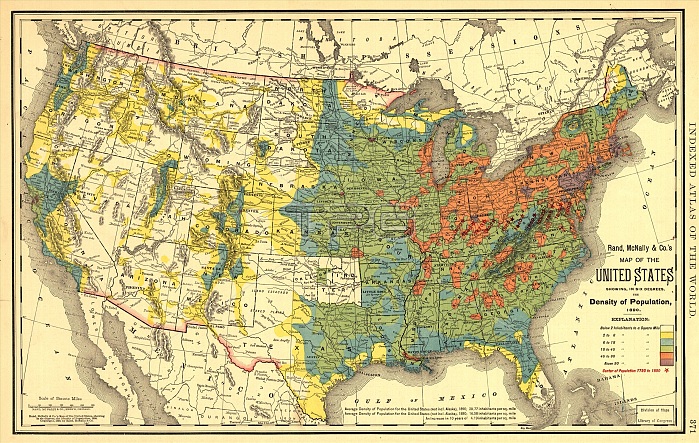
Rand, McNally & Co.s map of the United States showing, in six degrees the density of population, 1890, (1892). This map, published in 1892 by the Chicago-based Rand McNally and Company, shows the population density of the United States in 1890. Six shades of color are used to indicate the different levels of population density by location, ranging from fewer than two inhabitants per square mile (2.59 square kilometers) to more than 90 inhabitants per square mile. The most densely populated parts of the country are in the Northeast and parts of the Midwest. The West is for the most part sparsely populated, although already by this time Denver, Los Angeles, Salt Lake City, San Francisco, and Seattle are emerging as major cities. Red stars are used to indicate the westward movement of the countrys center of population, caused by a century of migration and settlement. A note at the bottom explains that in 1890 the overall population density of the United States (excluding Alaska) was 20.77 inhabitants per square mile, up from 16.58 inhabitants per square mile a decade earlier. Also shown are major geographic features including national and state borders, mountains, rivers and lakes, major roads, cities and towns, national parks, and Indian reservations.
| px | px | dpi | = | cm | x | cm | = | MB |
Details
Creative#:
TOP29694952
Source:
達志影像
Authorization Type:
RM
Release Information:
須由TPG 完整授權
Model Release:
Not Required
Property Release:
Not Required
Right to Privacy:
No
Same folder images:
 Loading