
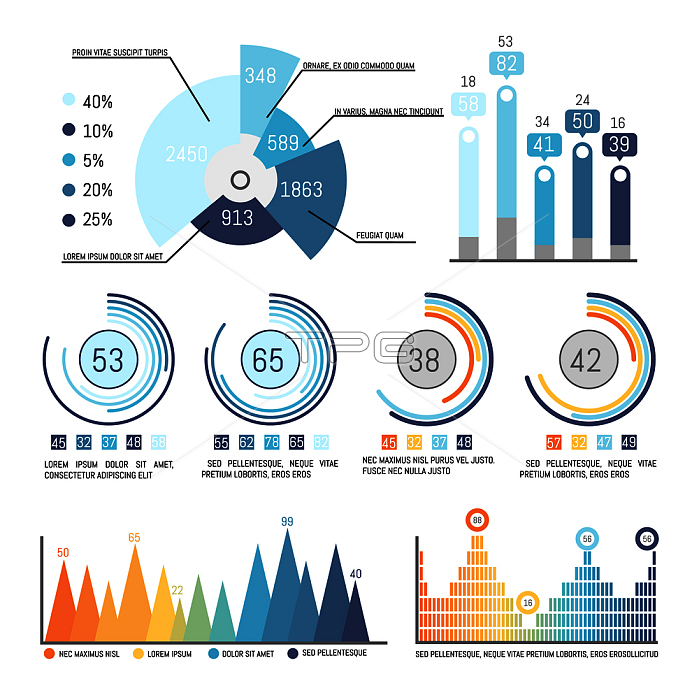
Pie diagram with parts and present statistical data vector. Infographics and infocharts with numeric info, flowchart, different distinguishing colors. Pie Diagram with Parts and Percent Statistics Data
| px | px | dpi | = | cm | x | cm | = | MB |
Details
Creative#:
TPG31175355
Source:
達志影像
Authorization Type:
RF
Release Information:
須由TPG 完整授權
Model Release:
No
Property Release:
No
Right to Privacy:
No
Same folder images:
Restriction:
eps檔
piediagrampercentinfographicsvectorpercentageinfographicinfochartflowchartchartgraphgraphicschemedesigntemplatecirclepresentationdatalayoutillustrationflatfigureideaflowresearchinformationrateexamineplanvisualizationbareditablestructuretableinvestigatesearchorganizationvisualexplorestrategynumberprojectlineinfoinfographsignanalyzereportplanningstatisticPiediagramwithpartsandpresentstatisticaldatavector.Infographicsandinfochartswithnumericinfoflowchartdifferentdistinguishingcolors.PieDiagramwithPartsandPercentStatisticsDataING_47129_48335.jpgooopicapiimagedjapiguaranaapi
DataDiagramING_47129_48335.jpgInfographicsPartsPercentPiePieStatisticsanalyzeandandandbarchartcirclecolors.datadatadesigndiagramdiagramdifferentdistinguishingeditableexamineexplorefigureflatflowflowchartflowchartgraphgraphicguaranaapiideaillustrationimagedjapiinfoinfoinfochartinfochartsinfographinfographicinfographicsinformationinvestigatelayoutlinenumbernumericooopicapiorganizationpartspercentpercentagepieplanplanningpresentpresentationprojectratereportresearchschemesearchsignstatisticstatisticalstrategystructuretabletemplatevectorvector.visualvisualizationwithwithwith
 Loading