
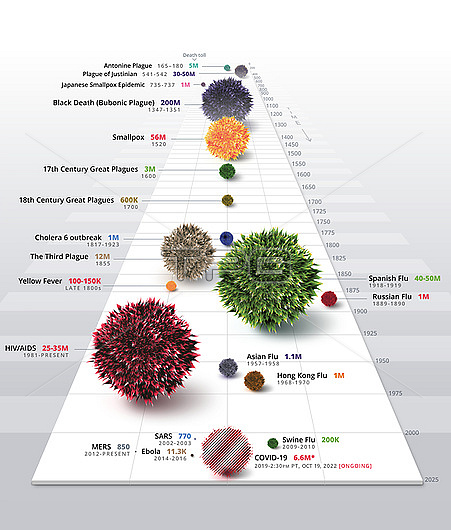
Infographic illustration depicting a timeline of major historical pandemics. Death toll is depicted by relative size of the spiked spheres. The timeline begins with the Antonine plague (165-180 AD) which was estimated to have killed 5-10 million people and was thought to have been measles or smallpox spread by Roman soldiers returning from the East. The highest pandemic death toll in history is the Black Death (1347-1351), which killed 200 million people. As of October 2022, COVID-19 is estimated to have killed 6.6 million people, making it the 7th worst pandemic in history.
| px | px | dpi | = | cm | x | cm | = | MB |
Details
Creative#:
TPG33842841
Source:
達志影像
Authorization Type:
RF
Release Information:
須由TPG 完整授權
Model Release:
n/a
Property Release:
n/a
Right to Privacy:
No
Same folder images:
illustrationartworkcgidigitally-generatednobodyno-onetextdatavisualizationvisualisationdatainfographicinfographicalchartgraphtimelinehistoryhistoricalplagueplaguesvirusespandemicdiseasedeathsdeathtollblackdeathbubonicplaguespanishflucovid-19coronavirusHIVAIDSmeaslessmallpoxinfectioninfectiousdiseasecommunicablediseaseantonineplagueswinefluinfluenza
AIDSHIVantonineartworkblackbuboniccgichartcommunicablecoronaviruscovid-19datadatadeathdeathdeathsdigitally-generateddiseasediseasediseasefluflugraphhistoricalhistoryillustrationinfectioninfectiousinfluenzainfographicinfographicalmeaslesno-onenobodypandemicplagueplagueplagueplaguessmallpoxspanishswinetexttimelinetollvirusesvisualisationvisualization
 Loading