
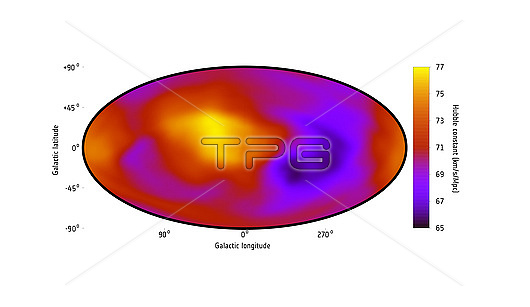
Illustration of the rate of expansion of the Universe. The rate of the Universe?檚 expansion, indicated in terms of the Hubble constant, is shown in different colours, with purple hues indicating a slower rate and orange/yellow hues indicating a faster rate. The map is based on data from ESA's XMM-Newton, NASA's Chandra and the German-led ROSAT X-ray observatories and shows the whole sky in the galactic coordinate system. The centre of Milky Way is located at the centre of the map and the plane of the galaxy (where most of its stars reside) oriented horizontally across the map (Milky Way stars are not shown in the map). The Hubble constant, measured in kilometres per second per megaparsec (km/s/Mpc), suggests that galaxies are moving away from the Earth at speeds proportional to their distance from Earth. A megaparsec is about 3,260,000 light years. The rate of expansion has been estimated using the X-ray temperature of hundreds of galaxy clusters across the sky and compared the temperature to the clusters??brightnesses. The data indicate that the rate of expansion may vary across the sky, the purple regions indicating a slower rate of expansion compared to orange/yellow regions. This variation challenges the isotropy hypothesis which assumes that, on large scales, the Universe has the same properties in each direction. This possible uneven effect on cosmic expansion might be caused by dark energy.
| px | px | dpi | = | cm | x | cm | = | MB |
Details
Creative#:
TOP26386449
Source:
達志影像
Authorization Type:
RM
Release Information:
須由TPG 完整授權
Model Release:
N/A
Property Release:
N/A
Right to Privacy:
No
Same folder images:
 Loading