
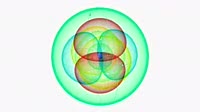
CO2 levels over Africa. Computer simulation showing how carbon dioxide (CO2) travels around the globe in Earth's atmosphere, showing the results for one month (August 2006) over Africa. Plumes of carbon dioxide in the simulation swirl and shift as winds disperses the greenhouse gas away from its sources. The concentration of carbon dioxide is colour-coded in parts per million by volume (ppmv) from relatively low levels (green, 380ppmv) through yellow (383ppmv) to relatively high concentrations (red, 385ppmv). The regular pulsing (green) is the daily production of CO2 by plants. High concentrations (red) can be due to natural fires and human use of fossil fuels. These high concentrations are much less in Africa compared to North America (K004/5257) or South-East Asia (K004/5258). This visualization is a 'Nature Run', a type of simulation that uses real data on atmospheric conditions and the emission of greenhouse gases. The simulation was produced by a computer model called GEOS-5 (Goddard Earth Observing System Model, Version 5), created at NASA Goddard Space Flight Center's Global Modeling and Assimilation Office. This is the highest-resolution simulation produced to date, with the results made available in 2014.


Details
WebID:
C01840120
Clip Type:
RM
Super High Res Size:
1280X720
Duration:
00:00:30.000
Format:
QuickTime
Bit Rate:
24 fps
Available:
download
Comp:
200X112 (0.00 M)
Model Release:
NO
Property Release
No
 Loading